Note:
%>% to process elegantly GPR data.RGPR# install "devtools" if not already done
if(!require("devtools")) install.packages("devtools")
devtools::install_github("emanuelhuber/RGPR")
library(RGPR) # load RGPR in the current R session
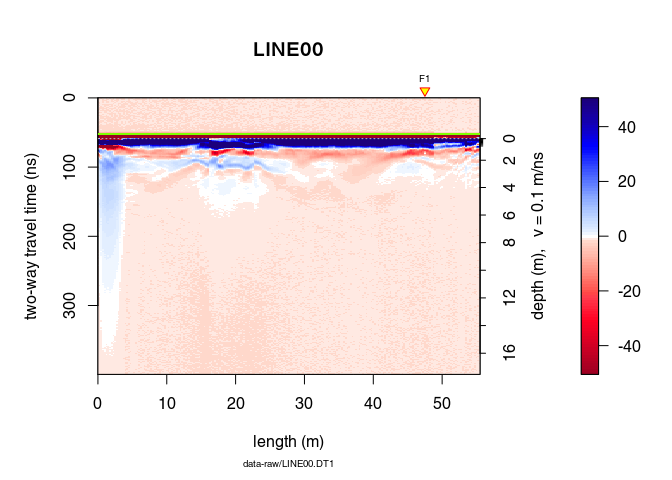
RPGR comes along with a GPR data called frenkeLine00. Because this name is long, we set x equal to frenkeLine00:
x <- frenkeLine00
plot(x)
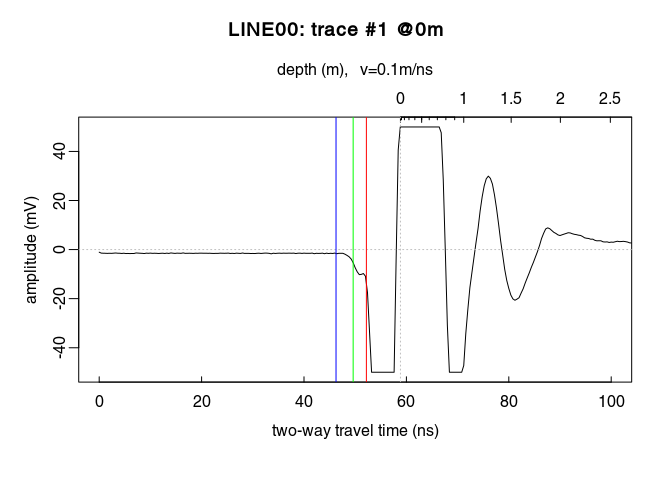
tfb <- firstBreak(x, w = 10, method = "coppens", thr = 0.05)
plot(x[,1], relTime0 = FALSE, xlim = c(0, 100))
t0 <- firstBreakToTime0(tfb[1], x[,1])
abline(v = c(tfb[1], t0[1]), col = c("green", "blue"))
Here a short excerpt of this webpage (https://magrittr.tidyverse.org/) that explains how to use %>%.
The operators pipe their left-hand side values forward into expressions that appear on the right-hand side, i.e. one can replace
f(x)withx %>% f(), where%>%is the pipe operator.
x %>% f is equivalent to f(x)x %>% f(y) is equivalent to f(x, y)x %>% f %>% g %>% h is equivalent to h(g(f(x)))With pipe operators, the code is more compact and better readable.
%>% pipe operatorRGPR exports the %>% pipe operator from the magrittr package.
Without pipe operator, we would code something like that:
time0(x) <- t0
x1 <- dcshift(x)
x2 <- dewow(x1, type = "runmed", w = 50)
x3 <- time0Cor(x2)
x4 <- fFilter(x3, f = c(100, 280), type = "low", plotSpec = FALSE)
x5 <- gain(x4, type = "agc", w =  5)
The same code with the %>% pipe operator.
xnew <- x %>%
  setTime0(t0) %>%
  dcshift() %>%
  dewow(type = "runmed", w = 50) %>%
  time0Cor() %>%
  fFilter(f = c(100, 280), type = "low", plotSpec = FALSE)  %>%
  gain(type = "agc", w =  5)
Note that we here the setTime0() instead of time0()<-. setTime0() is nothing else than a wrapper for time0()<-:
setTime0 <- function(x, t0){
  time0(x) <- t0
}
Currently, the other replace methods of RGPR(function()<-) do not have such a wrapper. Don’t hesitate to write you own wrapper.
%T>% tee operatorBut what if you would like to plot the GPR data after the dewow filter? The function plot() does not return anything… The solution is to use the tee operator %T>% before plot(). RGPR exports the %T>% tee operator from the magrittr package.
The tee operator works exactly like %>%, but it returns the left-hand side value rather than the potential result of the right-hand side operations (source)
Here the example:
xnew <- x %>%
  setTime0(t0) %>%
  dcshift() %>%
  dewow(type = "runmed", w = 50) %T>%
  plot() %>%
  time0Cor() %>%
  fFilter(f = c(100, 280), type = "low", plotSpec = FALSE)  %>%
  gain(type = "agc", w =  5)
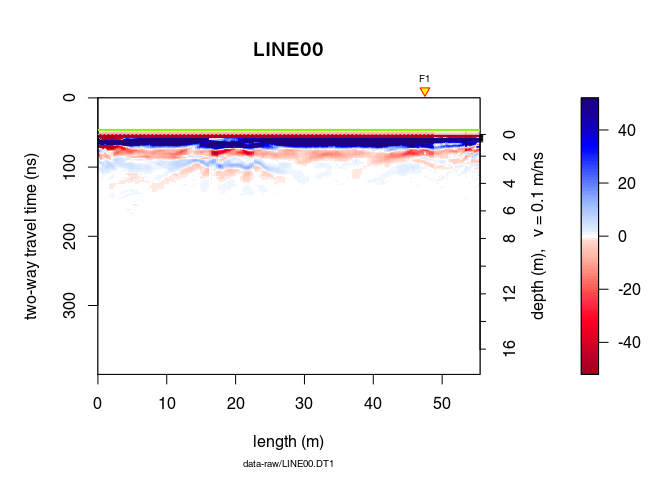
In this example dewow(type = "runmed", w = 50) %T>% plot() returns the output of the dewow() function.